
How Do You Speed Up flock Without Writing a Kernel?
For five weeks a public leaderboard has been keeping score on a single question: how fast can one prover be made to run. Every promoted submission carries a note saying what the author did. That gives us something we rarely get, which is an itemised, dated, independently motivated list of what it takes to speed up a binary-field prover.
We built the same prover on a compiler instead. flock-zorch is flock written against zorch, a scheme-agnostic set of SNARK building blocks in Python. It traces through FRX (our fork of JAX, which adds finite-field types and ops) and is compiled by prime-ir and our fork of XLA. There is no GPU code in the prover repository.
So we went through the list one entry at a time and asked: who would have done this work on our side?
The answer is not that we are faster. On the configuration the board scores we are level, and ours is the narrower measurement window. The answer is that the same optimizations land somewhere else, and where they land decides how far each one travels.
1. What is being measured
1.1 flock, and the board
flock proves R1CS over GF(2¹²⁸) with two sumcheck PIOPs (zerocheck and lincheck) and a Ligerito polynomial commitment. Its target statements are hash circuits. snark.fast runs a live competition on it: prove 2¹⁸ BLAKE3 compressions, 20 warm-up runs, then the median of 100 timed trials. Score is compressions per second.
Two definitions have to be pinned before any number means anything, and both cut against us.
The first is the window. The board times witness generation, IPC, serialisation, a disk write and file polling alongside the proof, and witness generation alone is 12 to 15 ms by their own profile. Ours times commit through open. Ours is the narrower window, so a raw comparison flatters us.
The second is the arm. flock lets you choose the hash behind Fiat-Shamir and Merkle. Upstream defaults to SHA-256, which our correctness gates pin; the board's fork uses BLAKE3 for both, and the two are 2.2× apart in wall time. Every comparison below uses the board's arm. Everything in the three sections that follow is arm-independent, because both arms run the same reduction and the same opening, and only the bytes entering the transcript change.
1.2 The cost model
One proof's wall time fits a line: T = F + c·H, where H is the number of hash
compressions in the proof, c is the marginal cost of one, and F is everything
that does not scale with H. Throughput is then H / (F + c·H).
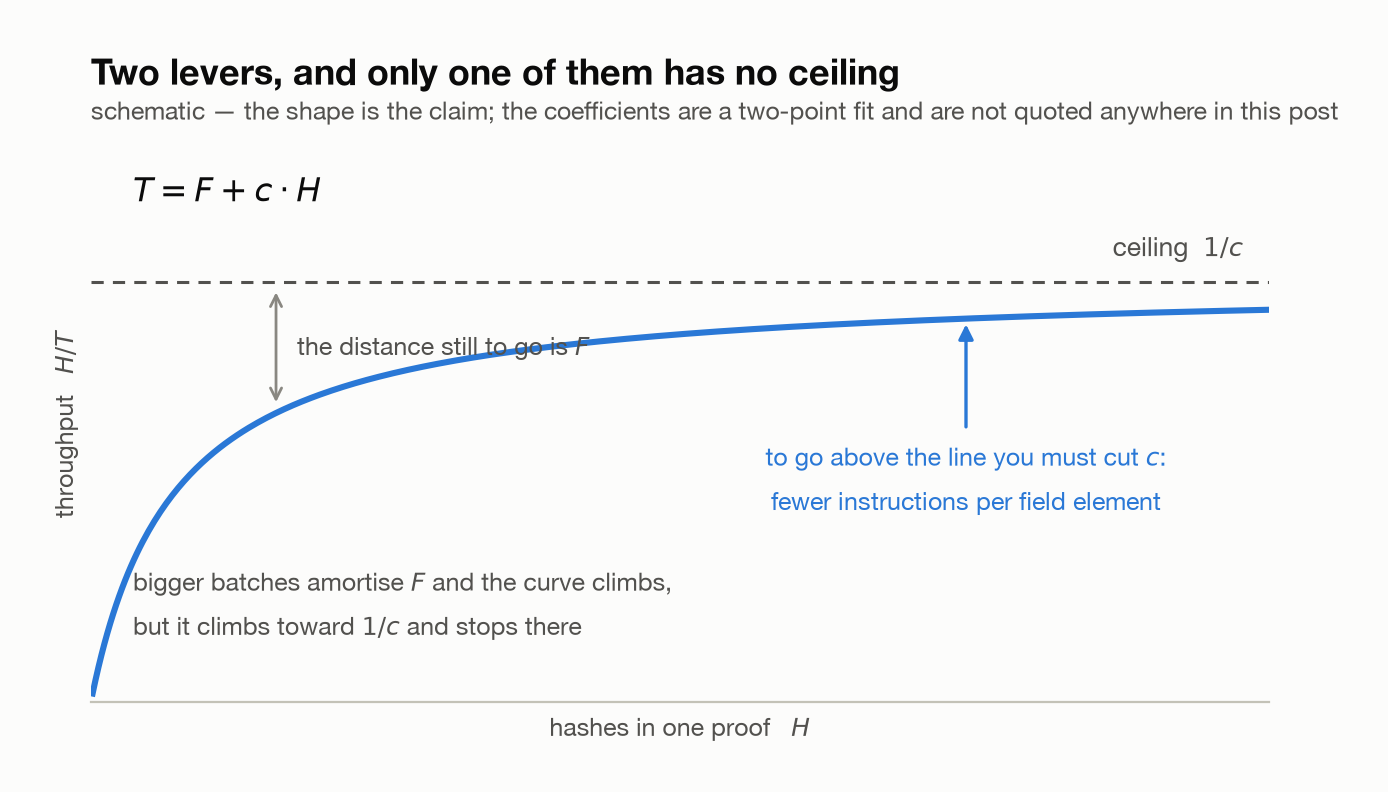
Batching works, and then it stops working. Bigger batches amortise F, which is
why every prover's hash/s table climbs with batch size. The model does not deny
that climb. It says the climb has a ceiling at 1/c, and at the scored size we
are already near it. Going past it means cutting c itself.
F and c are a slope and an intercept, not an accounting category. The only
thing that decides where a cost lands is how it scales with H. The linear
things are c: witness generation, NTT, Merkle leaf hashing, the sum over
sumcheck rounds. Anything constant, or O(log H), is F: Merkle's upper levels,
the number of sumcheck rounds, the recursion depth, host-to-device
synchronisation, and the program boundaries that synchronisation creates.
That split is where the compiler argument starts, because both terms factor the same way: how much work the protocol asks for, times what one unit of that work costs on this target.
F counts the places the program stops — the number of sumcheck rounds, the
recursion depth, the host round trip around each program boundary. Fusion is
the lever on it, because fusion is what removes a boundary. c counts what one
element costs once the program is running, in instructions per multiply and
bytes moved per compression. Instruction selection is the lever on that one.
The split is not clean in both directions — fusing two kernels that are linear
in H cuts per-element memory traffic, which is c — but the levers map the
way you would expect.
The left factor stays the author's. Fold two rounds into one and F drops;
delete a scan that the instance makes redundant and c drops. We wrote both,
in Python, and section 3 is about where such changes belong. The right factor
is what this post is about, and in a hand-written kernel it has no separate
owner, so it lands on the kernel author — once per kernel, once per ISA.
2. Nineteen jumps
2.1 Who would have done each one
Of 2,106 submissions and 222 promotions, 19 moved the frontier by at least 2%. Together they explain 47% of the total climb in log terms; the rest is the accumulation of sub-1% increments. Here they are, coloured not by which hardware they targeted but by who would have done that work in our stack.
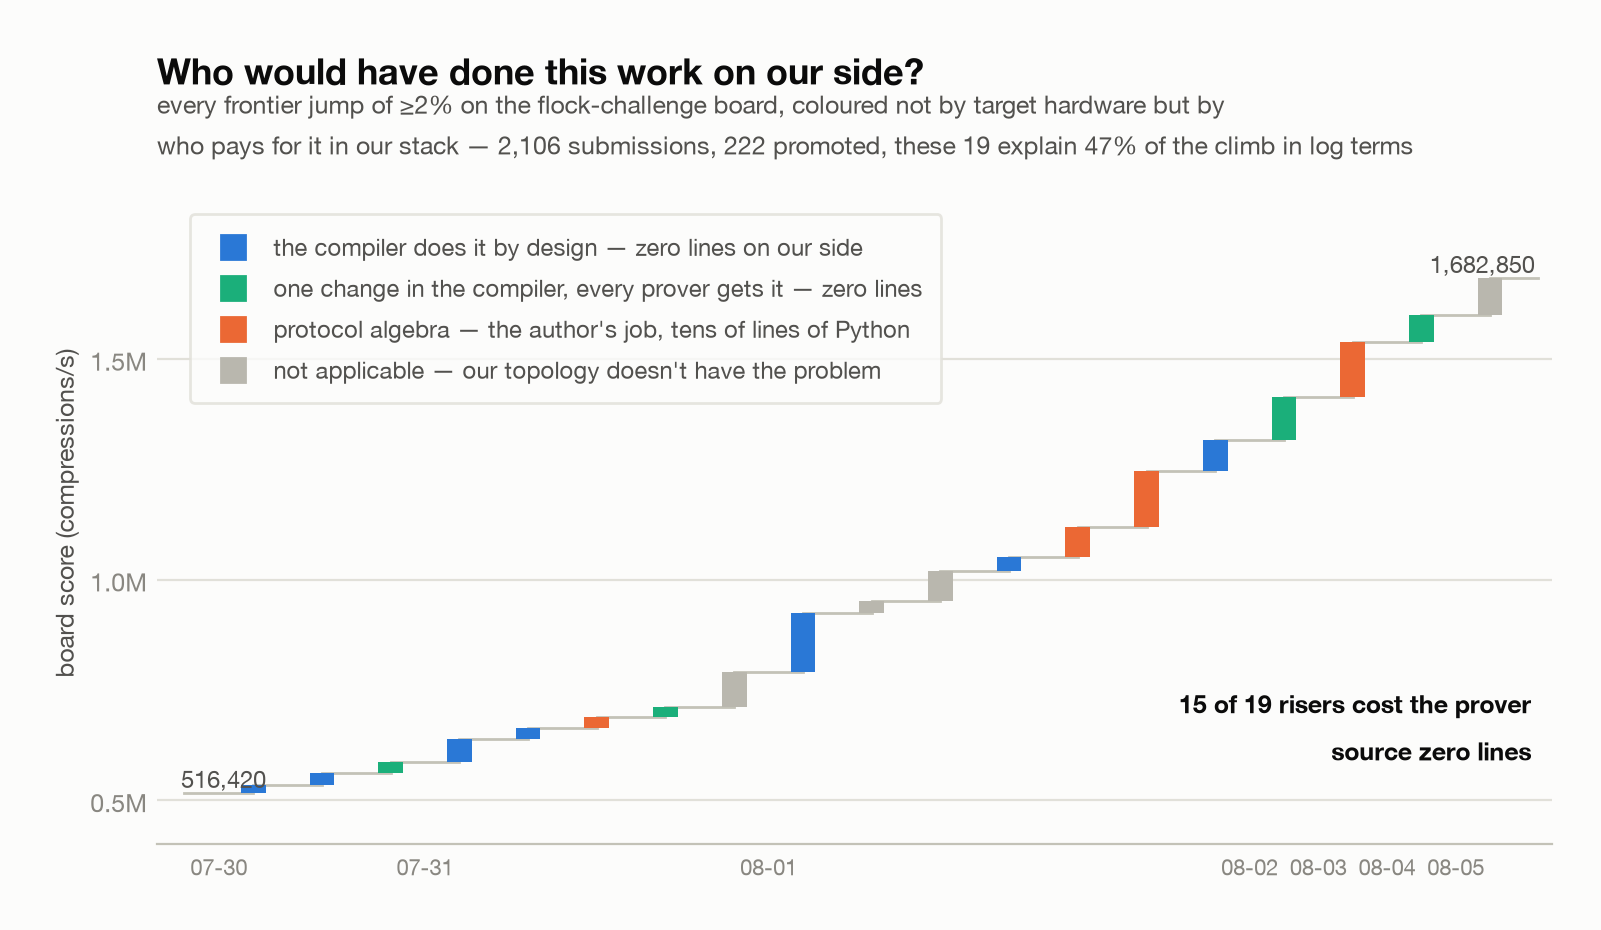
Fifteen of the nineteen cost our prover source zero lines. Seven are things the compiler does by design: buffer reuse, twiddle caching, constant tables, moving commit onto the GPU. Four are single compiler changes that every prover on the stack inherits. Four do not apply to us at all, because they schedule work across Apple's performance and efficiency cores and our topology has no such split. The remaining four are protocol algebra, which we did write, in tens of lines of Python.
Through the cost model the shape is sharper. Most of their jumps (core
scheduling, filling the GPU's wait window, buffer reuse, memory pinning) are F
hunts, and that F is either already gone on our side or never existed. The c
hunts are four algebra deletions and three field-arithmetic changes. We took the
algebra too; the field arithmetic is a compiler concern.
One date is worth noting: on 08-01 the frontier gained 34.6% in a single day, which is when they brought a GPU in. We had been running as one program on a GPU since the first day.
2.2 Karatsuba: in a kernel, and in a lowering pass
Karatsuba is the board's busiest lane, mentioned in 129 notes and present in 25 promotions. That popularity is what makes it a good example.
The frontier's promoted change reads:
"The q-register-native zerocheck round-two kernel uses Karatsuba for each GF(2^128) product, reducing four independent schoolbook PMULL operations to three PMULL operations plus XOR/shuffle."
It touches exactly two files: a field module and
zerocheck/multilinear/kernels/aarch64.rs. One kernel, one ISA — and the NTT is
the check on what that means. That kernel re-implements the multiply in-kernel so
every value stays in a q register, which means it inherits nothing from the field
module where the Karatsuba version already sits: its mul_q is four schoolbook
PMULLs, and the doc comment says as much. When the same identity was tried in
another kernel it regressed the full proof and was reverted.
Counting the copies makes the shape plain. There are at least five GF(2¹²⁸)
multiplies in that crate, and each one carries its own Karatsuba decision. The
scalar F128::mul picks Karatsuba on x86 and schoolbook on ARM, with a comment
in the source giving the reason — Zen 4 wins on throughput, M-series picked the
other. The zerocheck kernel reaches the opposite verdict on those same two ISAs.
The NTT kernel is schoolbook on both. Five copies, five verdicts, held in step by
hand.
Our version of the same idea is a helper in a prime-ir lowering pass,
+62/−35 lines:
// Karatsuba — 3 sub-products instead of 4 (cross term
// a₀b₁ + a₁b₀ = (a₀+a₁)(b₀+b₁) + a₀b₀ + a₁b₁), which trades two clmad for
// six XOR. Worth it because this multiply is clmad-issue-bound on sm_120,
// so the XORs issue alongside for free.
Value aXor = arith::XOrIOp::create(b, a0, a1);
Value llLo  = emitClmad(b, a0, b0, z, /*isHi=*/false);
...
Value midLo = emitClmad(b, aXor, bXor, foldLo, /*isHi=*/false);
Every multiply on that backend gets it, in every prover on the stack. The prover source does not change by one character, because it never mentioned a multiplication strategy in the first place. The entire sumcheck round message is this:
p0, p1 = split_halves(stacked) if msb else split_pairs(stacked)
combined = combine(*frx.vmap(domain.sample)(p0, p1))
if weight is not None:
    combined = combined * weight        # this `*` is the GF(2¹²⁸) multiply
return fnp.sum(combined, axis=1)
| the frontier | us | |
|---|---|---|
| where | zerocheck/…/kernels/aarch64.rs | a lowering pass |
| reach | that kernel, that ISA | every kernel on that backend, every prover |
| other kernels | written again; once regressed, then reverted | automatic |
| prover source change | the kernel is the prover source | zero lines |
2.3 Without a compiler, a compiler grows anyway
The most telling evidence is not in the notes. It is in the filenames.
The same algebraic change appears three times in one commit, once per ISA:
kernels/aarch64.rs, kernels/portable.rs, kernels/x86_64.rs. Later commits
add kernels/aarch64_bstatic_gen.rs (a Rust file that generates kernels) and
merkle/blake3_neon8_codegen.c, a C program whose output is assembly, checked in
beside the .S files it produces. Another adds 883 lines of Metal shader source
held in strings.
This is not a criticism. Under the constraints it is the right move, and it is the move anyone makes at that scale. It is an observation about where the problem goes when you do not start with a compiler: by the end of the climb they were writing code generators, inside the crate, per kernel, per ISA, by hand. The problem does not disappear. It relocates.
3. Where an optimization lives
Every optimization carries a precondition: what must be true for this to be correct? How broad that precondition is decides how much code can inherit it, and therefore where it should live.
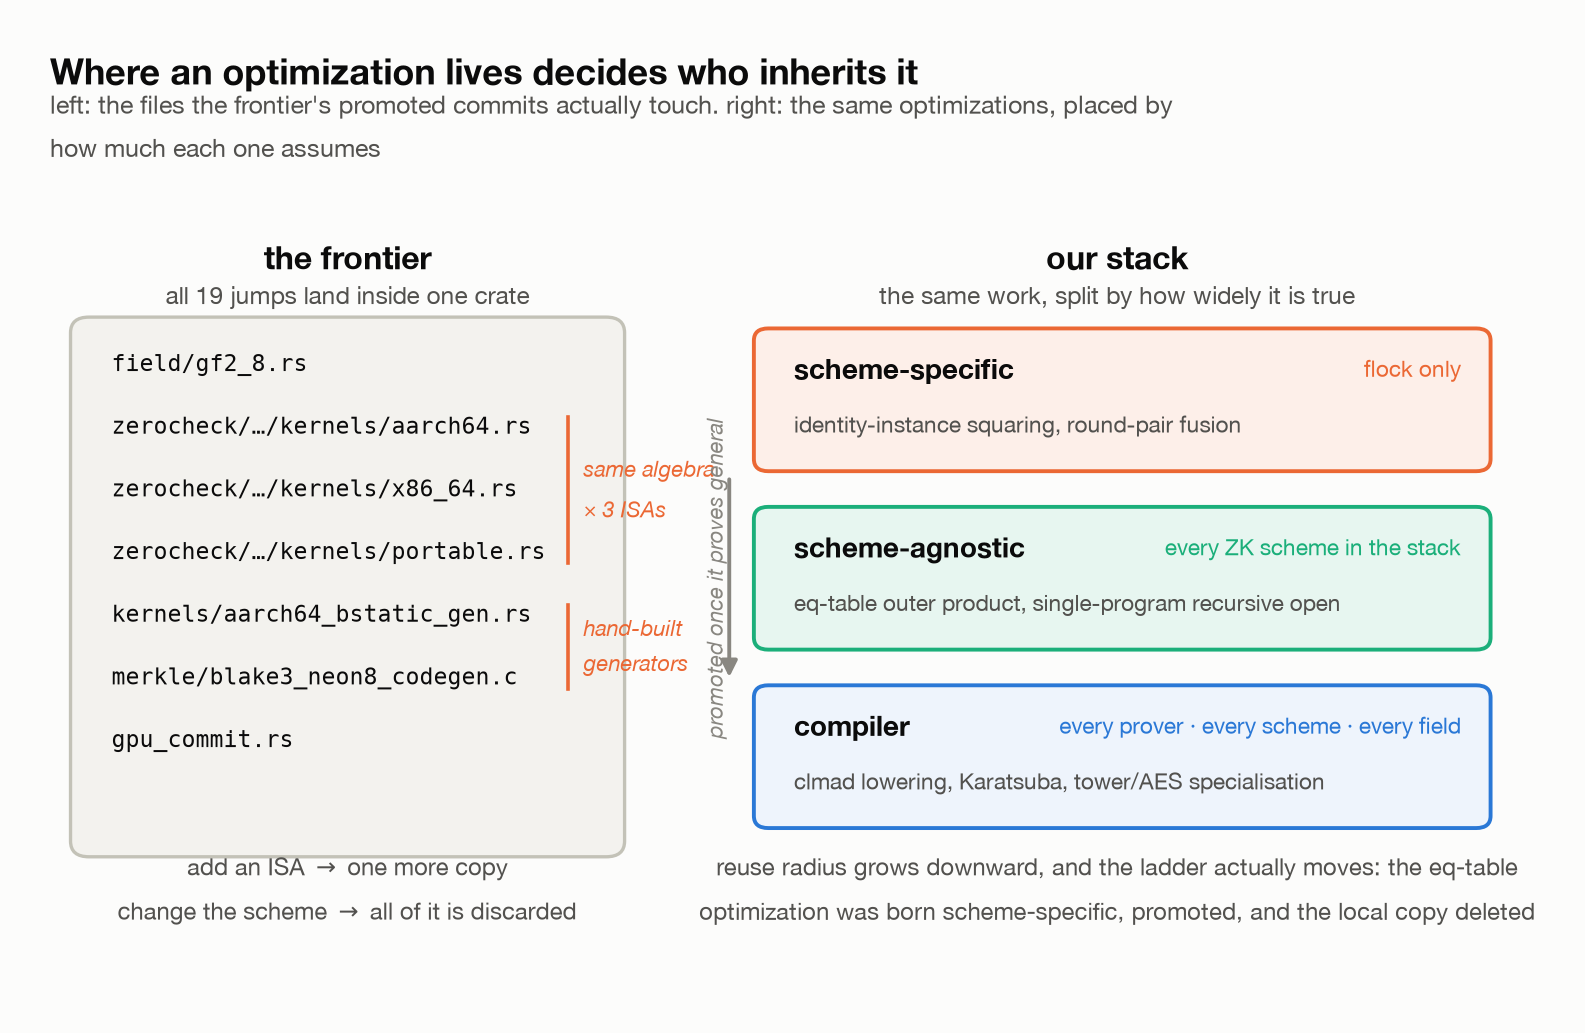
Two of ours sit at the extremes.
Take a broad one. Every sumcheck-family protocol uses an equality-polynomial table, and because that polynomial is a product, it splits into a tensor product wherever you cut it:
So the suffix tables need not be built separately: build one half once, expand by
outer product. That assumes nothing about flock, so it lives in zorch, the
scheme-agnostic layer, and every scheme on the stack inherits it.
Now a narrow one. flock's R1CS is generally , and the round message has to handle a product of two different multilinears. But the identity instance is , where both factors are the same polynomial. Every product becomes a square, and in characteristic 2 squaring distributes over addition because the cross term vanishes:
That takes the round from six multiplies to three. On a hash circuit, where
, the gain is exactly zero. Narrow precondition, so it lives
in flock-zorch and nowhere else.
The ladder is not decorative. The equality-table optimization was born in the scheme-specific layer, was promoted once it proved general, and the local copy was then deleted in two follow-up changes that were net line removals. A structure with one compartment has nowhere to record that move.
There is also a line the compiler cannot cross. A compiler transformation must preserve the output of the program it is given: Karatsuba, instruction selection, fusion and buffer placement are all "the same value, faster". But "this scan can be deleted because " is a fact about the protocol, not about the program. The graph records that one array is read to produce another. Whether the result happens to equal an array already in hand depends on which instance is being proved, and it is true of the identity instance but not of the general R1CS the program was written against. A compiler has to stay correct for every input it might be handed, so it keeps the scan. It can be told, and that is what the scheme-specific layer is for, but telling it asserts something the graph does not contain, which makes it a different program and the author's call.
The compiler owns how to compute. The author owns what to compute. In a hand-written kernel those two live in the same file, which is why changing the ISA means rewriting the algebra along with it.
4. The multiply is a codegen decision
CUDA 13.3 exposed clmad, a carry-less multiply-accumulate, in PTX for SM 80 and
newer. NVIDIA's own announcement uses GF(2¹²⁸) sumcheck as a motivating example.
A build that falls back to a software carry-less multiply runs the scored size in 1,141 ms; the clmad build
runs it in roughly 70 ms. One lowering decision is worth 16×.
Metal has no carry-less multiply at all, and the frontier measured what that costs: moving zerocheck's round two to the GPU gave them 97 ms against 17 ms on the CPU, so they withdrew GF(2¹²⁸) multiplication from the GPU permanently. Every Metal offload promoted afterwards is XOR and BLAKE3 only, which makes their GPU a hashing coprocessor. What is left for them is shrinking table lookups, and that option does not exist for us, because ours is an instruction rather than a table.
What makes this a compiler concern rather than a kernel concern is that the best multiplication schedule is a property of the target, not of the algebra. We have four data points:
| target | what is scarce | best schedule |
|---|---|---|
NVPTX with clmad | clmad issue slots | Karatsuba, three sub-products; the extra XORs issue in the shadow for free |
| no carry-less instruction | every ALU | Karatsuba, since sub-products are expensive and 4 to 3 pays a lot |
| ARM with PMULL | PMULL | Karatsuba plus deferred reduction, because reduction also consumes PMULL and deferring erases it |
| Metal | nothing to spend | withdraw field multiplication from the GPU entirely |
The clearest case is deferred reduction, which appears in 31 board notes and 8
promotions. On ARM it is a real win, because reduction uses PMULL and PMULL is
scarce. On our NVPTX path reduction is shifts and XORs while the multiply chain
is bound on clmad issue, so it already runs free in the pipe's shadow: halving
its ALU work is worth +0.3%, which is noise. Push reduction into clmad and it
costs −35%, because that moves work from a free resource onto the scarce one.
Same transformation, opposite verdict, decided by what the target is short of. We reached it in a day, because as a compiler pass the microbenchmark-then-discard loop is cheap. A compiler makes good optimizations cheap to acquire. It also makes bad ones cheap to throw away, which matters about as much.
And note who could even know the answer: it depends on the deployed toolchain version, not just the chip. That is not a prover author's job to track.
5. The measurements
All figures below: one RTX 5090, measured 2026-08-14 on an idle card, with the
CUDA toolchain pinned to 13.3 for both ptxas and nvlink.
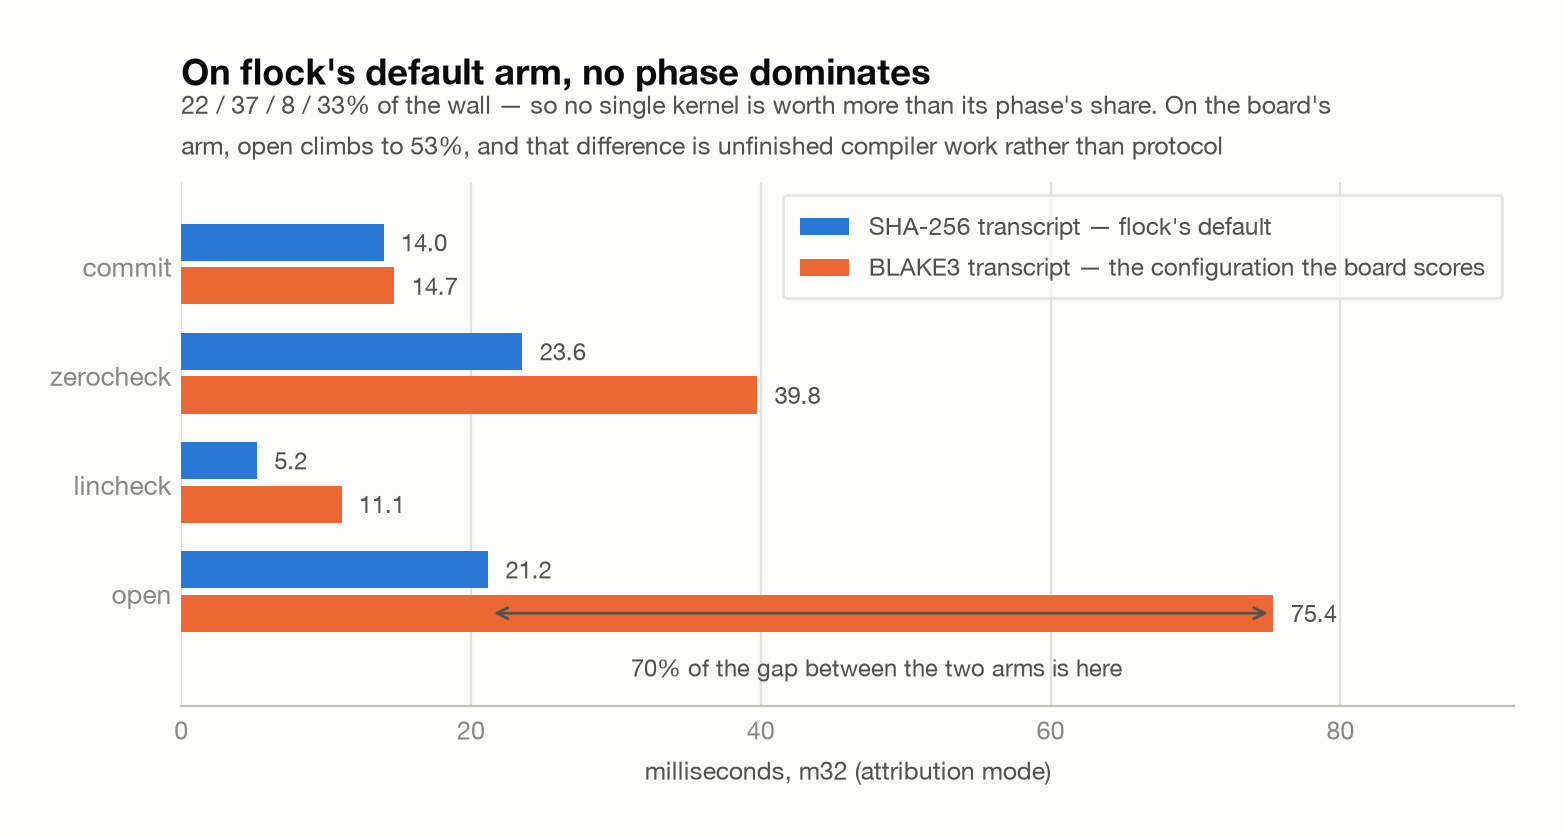
On flock's default arm the work is spread evenly, 22 / 37 / 8 / 33% across commit, zerocheck, lincheck and open. No phase dominates, which means no single kernel can be worth more than its phase's share, and it is the first reason the unit of optimization has to be the thing that makes all the kernels rather than any one of them.
Commit is essentially closed between the arms (+0.74 ms). Getting there meant handing Merkle's parent levels to the compiler as a marker, which took that stage from 811 kernels and 1.869 ms to 20 kernels and 0.061 ms, one per level.
The gap between the arms is real and we know what it is. Of the 77 ms, 70% sits in open and 21% in zerocheck, and the cause is not the protocol. On the BLAKE3 arm the Fiat-Shamir transcript carries a device-side streaming hash state through the sumcheck round loop, and those compressions are not yet fused, so they run scattered, once per round. The SHA-256 arm has a dedicated emitter in the same position. The gap is unfinished compiler work, not a protocol fact.
So, plainly:
- On the board's scored configuration we are at 1.88M compressions/s against a frontier of 1.80M. That is level, and since our timing window excludes witness generation and serialisation while theirs does not, matching the windows would likely put us behind.
- On flock's default arm we are at 4.12M.
One measurement settled an internal argument rather than an external one. Against
binius-gpu's hand-written additive_ntt_kernel (same algorithm, same field) the
compiler-emitted kernel is 1.8 to 2× faster. That ended our work on hand-written-kernel
FFI. Not on principle; on the number.
6. What is left, and what we gave up
Profiling says there is nothing left in the kernels: nearly every large one sits near the memory-bandwidth roofline, and none are compute-bound. The one exception is not reachable from the source, for a reason we come back to below.
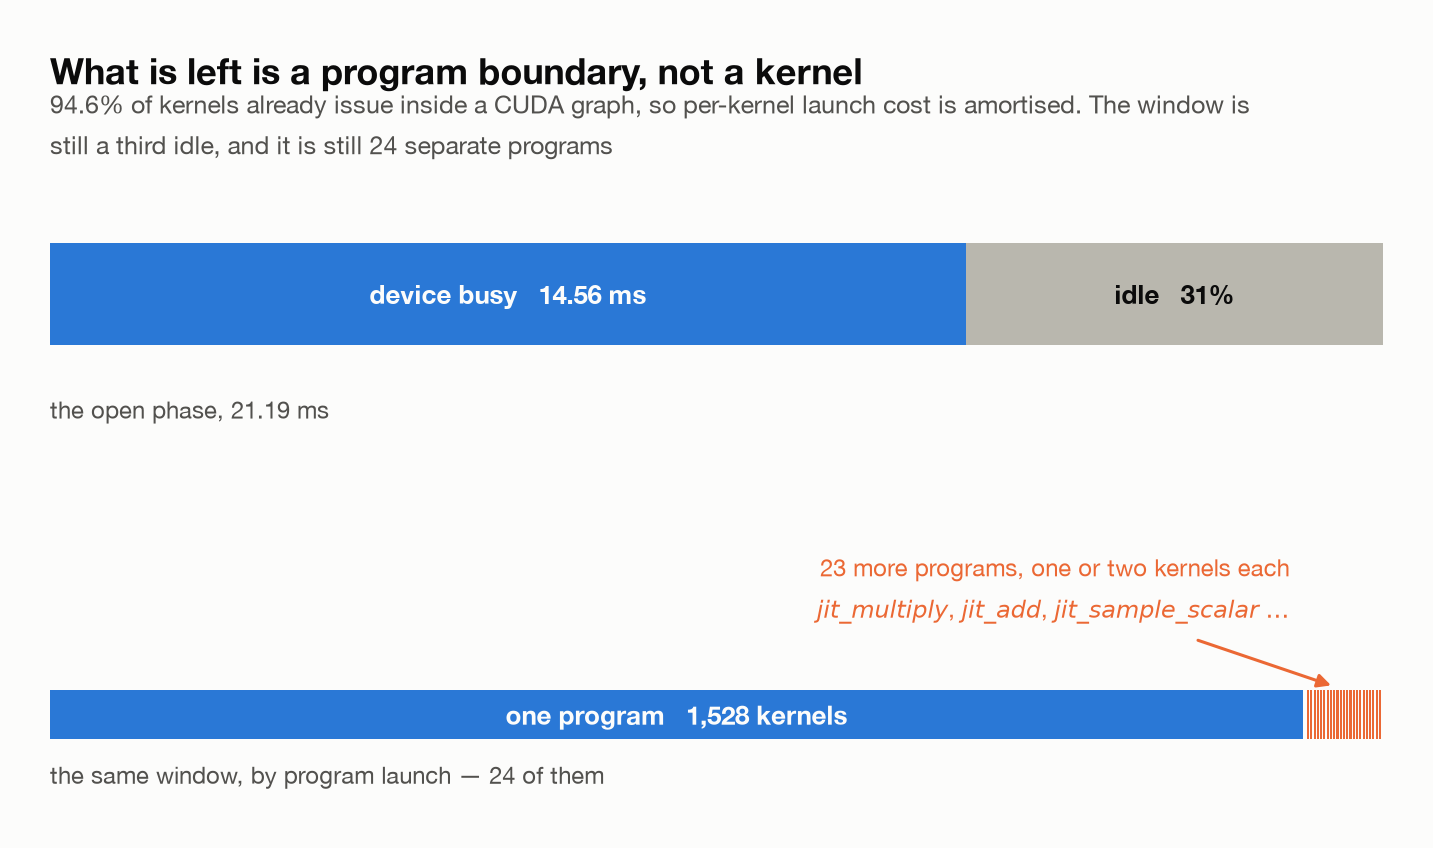
About a third of the opening window is device-idle. One cause is structural: as the Ligerito recursion descends, the work halves at each level but the kernel count does not, so the lower levels are too small to fill a 5090. That is occupancy, not dispatch. Another is genuinely serial: each Fiat-Shamir challenge is a hash of the previous round's message. We made that chain device-resident; we cannot make it parallel. That is the honest answer to "why does a GPU not run away from a CPU here", because the GPU wins on the wide stretches and gives it back on the narrow serial spine, where the CPU has nothing to lose.
The largest fixable share is neither. The window is still 24 separate program launches: one holds 94% of the kernels, and 23 others are one- or two-kernel programs, a multiply here, a scalar sample there. Those are transcript hops that have not been fused into the body yet, and nothing in the protocol requires them to be separate programs.
This is not launch overhead. 94.6% of kernels already issue from inside a CUDA graph, so the per-kernel dispatch cost is amortised away. What has to go is the program boundary and the host round trip around it, not the launch.
And the trade has a cost, which we have paid:
- The blast radius of a fix is the whole system. The one kernel in our profile that is not near the roofline is there because the compiler's cost model declined a fusion, and no source-level rewrite we tried produced different code. There is no kernel file to open. Every option is global: change the generator and revalidate everything it emits, avoid a toolchain version wholesale, or wait for the vendor. This is the exact underside of the strength, since "fix it once and everything improves" is the same property as "you cannot make one local exception."
- Bad defaults are invisible. Good defaults are invisible, and so are bad ones. One kernel family was losing more than 10× to a default thread mapping, and the symptom lied about the cause.
- Protocol algebra is still a person's job. The compiler removed the need for a kernel specialist, not a protocol specialist.
7. Conclusion
The claim here is deliberately narrow. It is not that we are faster than a leaderboard full of good engineers. On the configuration they score we are level, and ours is the kinder window. It is that we arrived differently, and the difference shows up in what happens next.
Fifteen of the nineteen jumps cost our prover source zero lines. The four that
cost something were protocol algebra, which is the part that should. Optimizations
that proved general moved down a layer and the local copies were deleted. The
same field multiply lowers to pclmulqdq, PMULL or clmad depending on where it
lands, and a transformation that is a clear win on one target was rejected on
ours in a day, on a microbenchmark, without touching a prover.
None of that makes a kernel faster than a specialist could. It makes the optimization outlive the prover it was written for.
zorch, flock-zorch and prime-ir are open source; awesome-zorch.fractalyze.io is the place to start.
The frontier's list of hand-done work turned out to be a feature list for a
compiler. And at the end of the list, they were writing blake3_neon8_codegen.c.
Appendix: measurement notes
Window and arm. Our --throughput mode times commit→open, excluding witness
generation and serialisation; the board's window includes both plus IPC, a disk
write and file polling. Witness generation is fully parallel and we have a
device-side implementation, but it is not wired into the timed path and no number
here includes it. Every board comparison uses the BLAKE3 arm the board scores;
flock's upstream default, and the arm our byte-match gates pin, is SHA-256. The
two are 2.2× apart and must never be mixed in one comparison.
Modes. Phase attribution inserts barriers and runs about 2% slower than throughput mode. Phase splits are quoted from attribution mode; wall times and hash/s from throughput mode.
Correctness. Every build is gated byte-for-byte against a reference proof. This is the reason a zero-line optimization is not a leap of faith: when a zerocheck restructuring broke the GPU identity byte-match while the CPU gate stayed green, the failure was localised to lowering within a day. All the strategies described here emit bit-identical proofs.
Toolchain. ptxas and nvlink are pinned to the same CUDA version. Mixing
them degrades silently or fails to link, and if the clmad path fails to engage
the build falls back to a software multiply without warning: the
16× cliff described earlier.